Visual Workflow Editor
The workflow editor lets you build automation pipelines by connecting nodes on a visual canvas. Drag nodes from the palette, wire them together, configure each step, and run the whole thing without writing code.
This page covers how to open the editor and what each part of the screen is for. To learn how to build, save, and run a workflow end-to-end, see Build & Run.
Open the Editor
Click Workflows in the icon rail on the left side of the app. You land on a home page with a quick-start guide, your saved workflows in the sidebar, and a row of quick-action buttons.
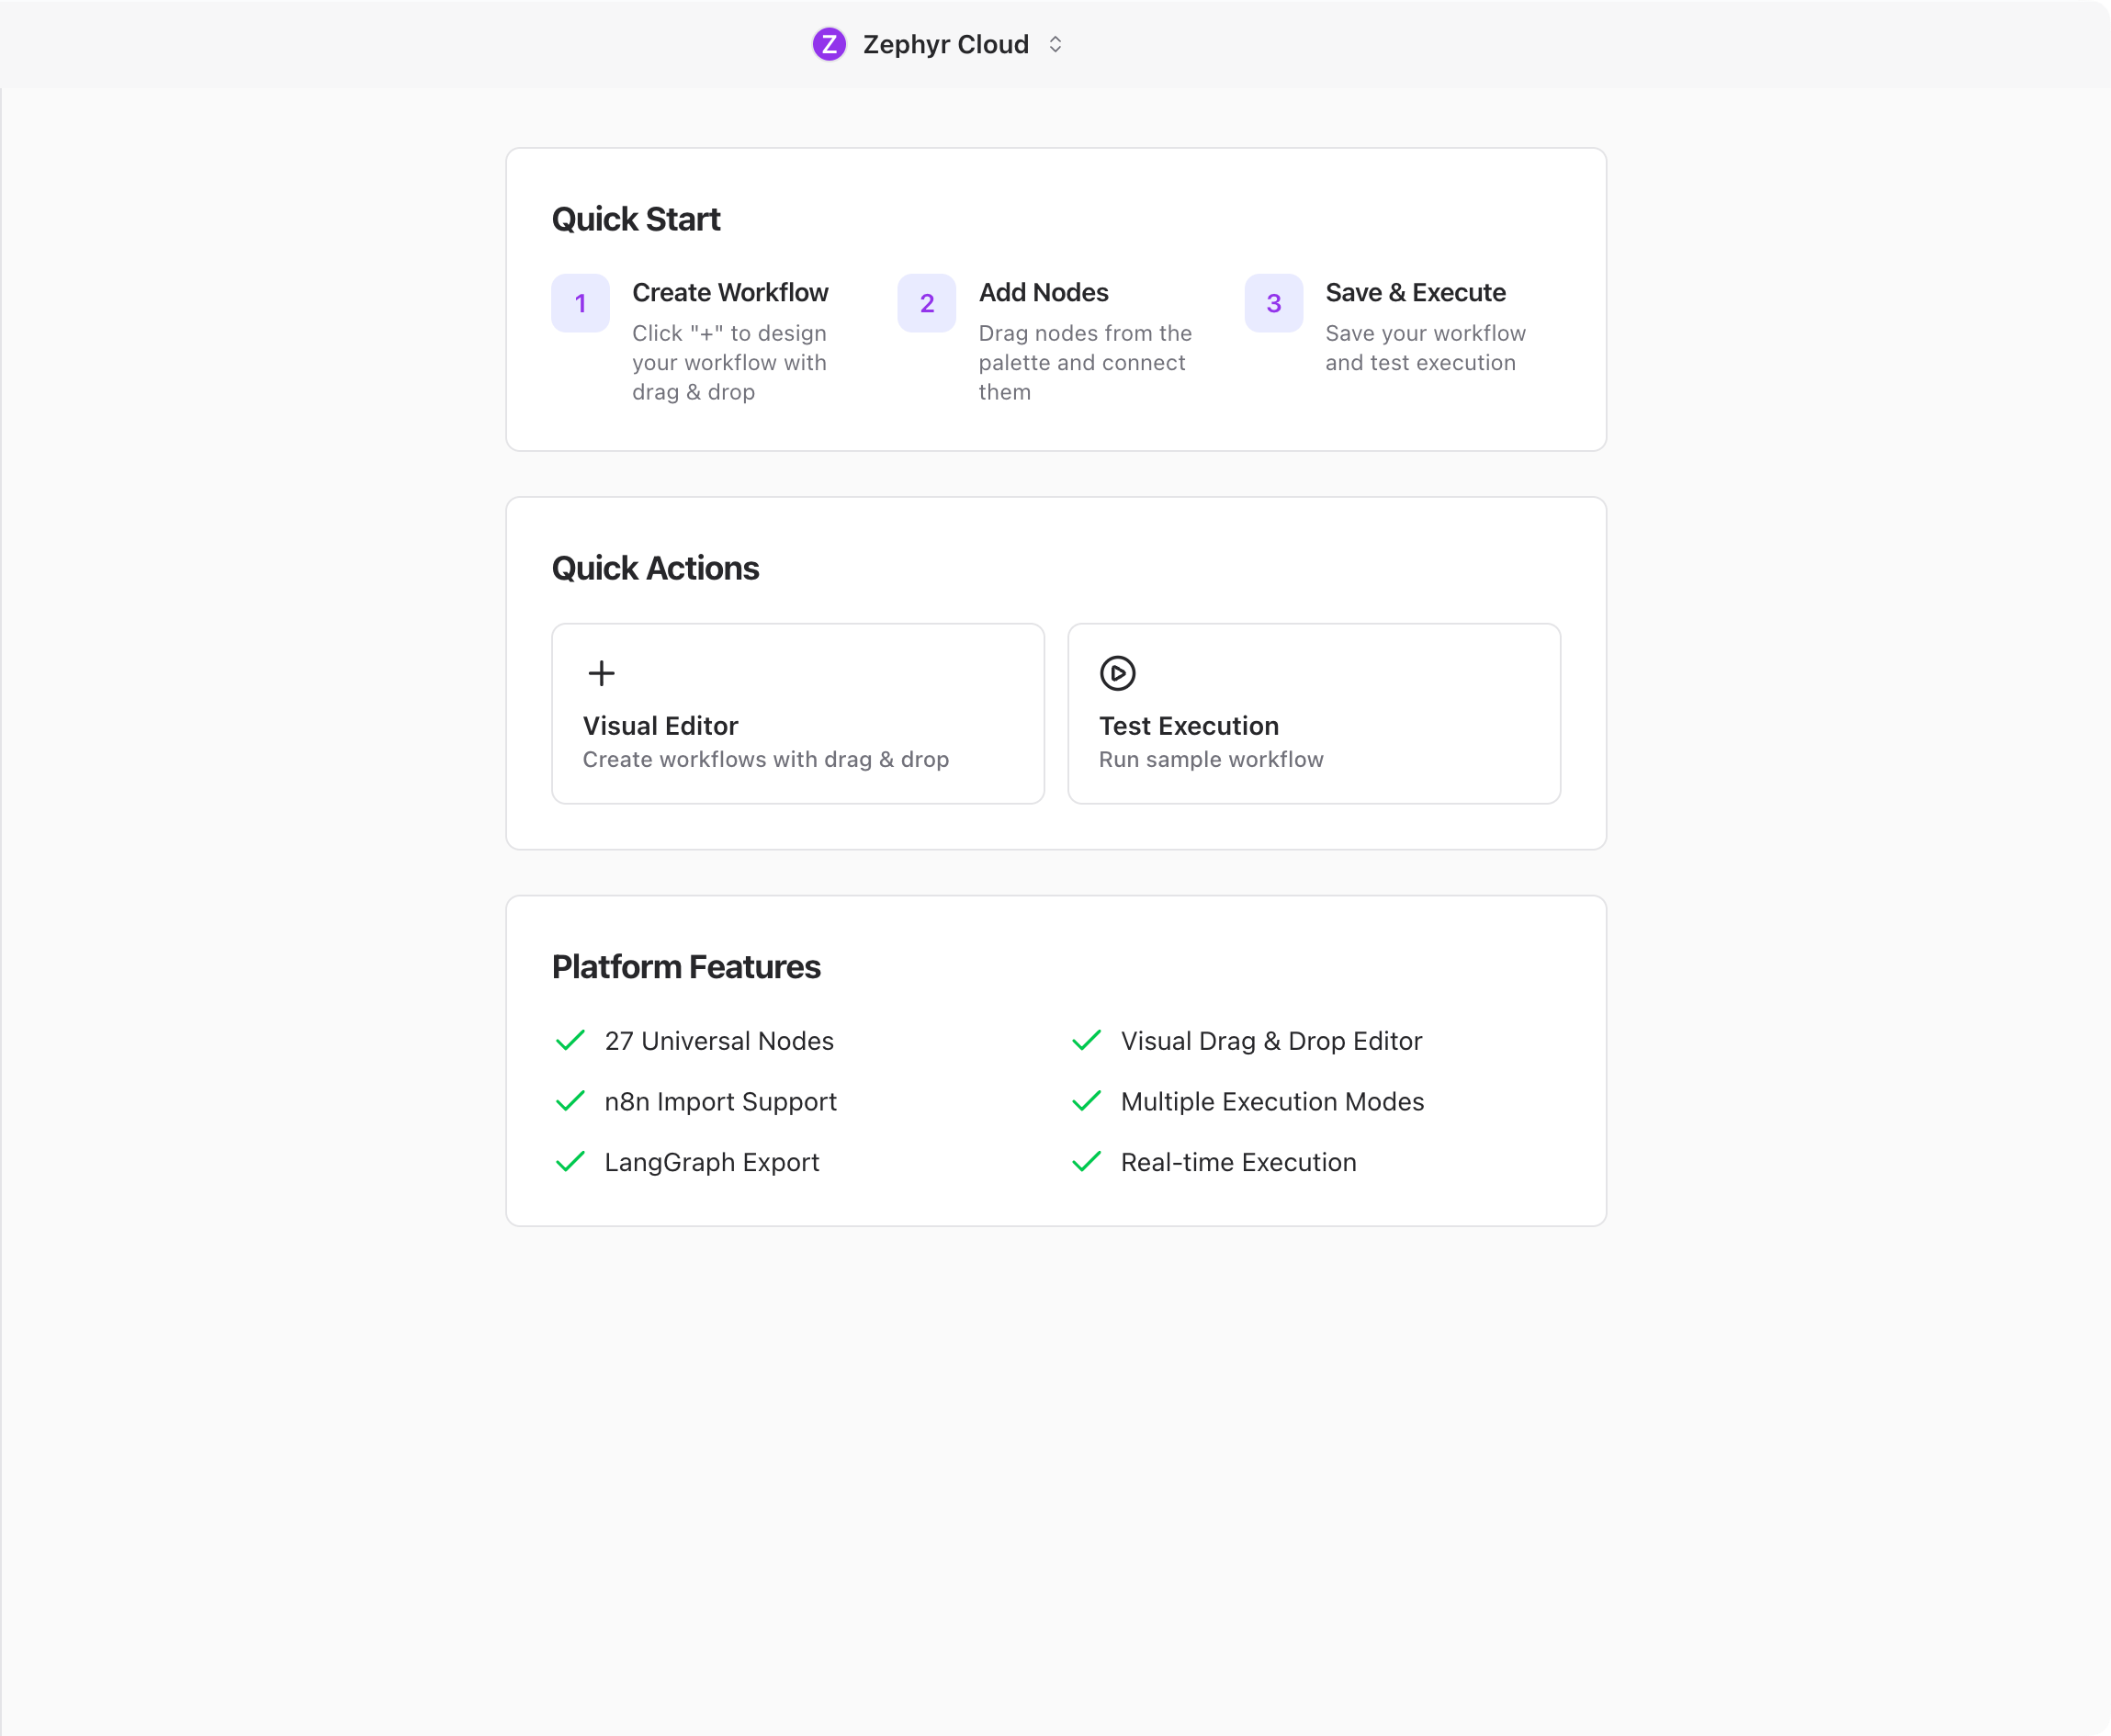
From the home page you can:
- Click Visual Editor to open a fresh, blank canvas.
- Click Test Execution to run a sample workflow without building one yourself.
- Click any saved workflow in the sidebar to open it. Each card shows the workflow name and an execution-mode badge.
- Click the
+in the sidebar header to create a new workflow.
The Editor Layout
The editor fills the screen with a top toolbar and three vertical panels.
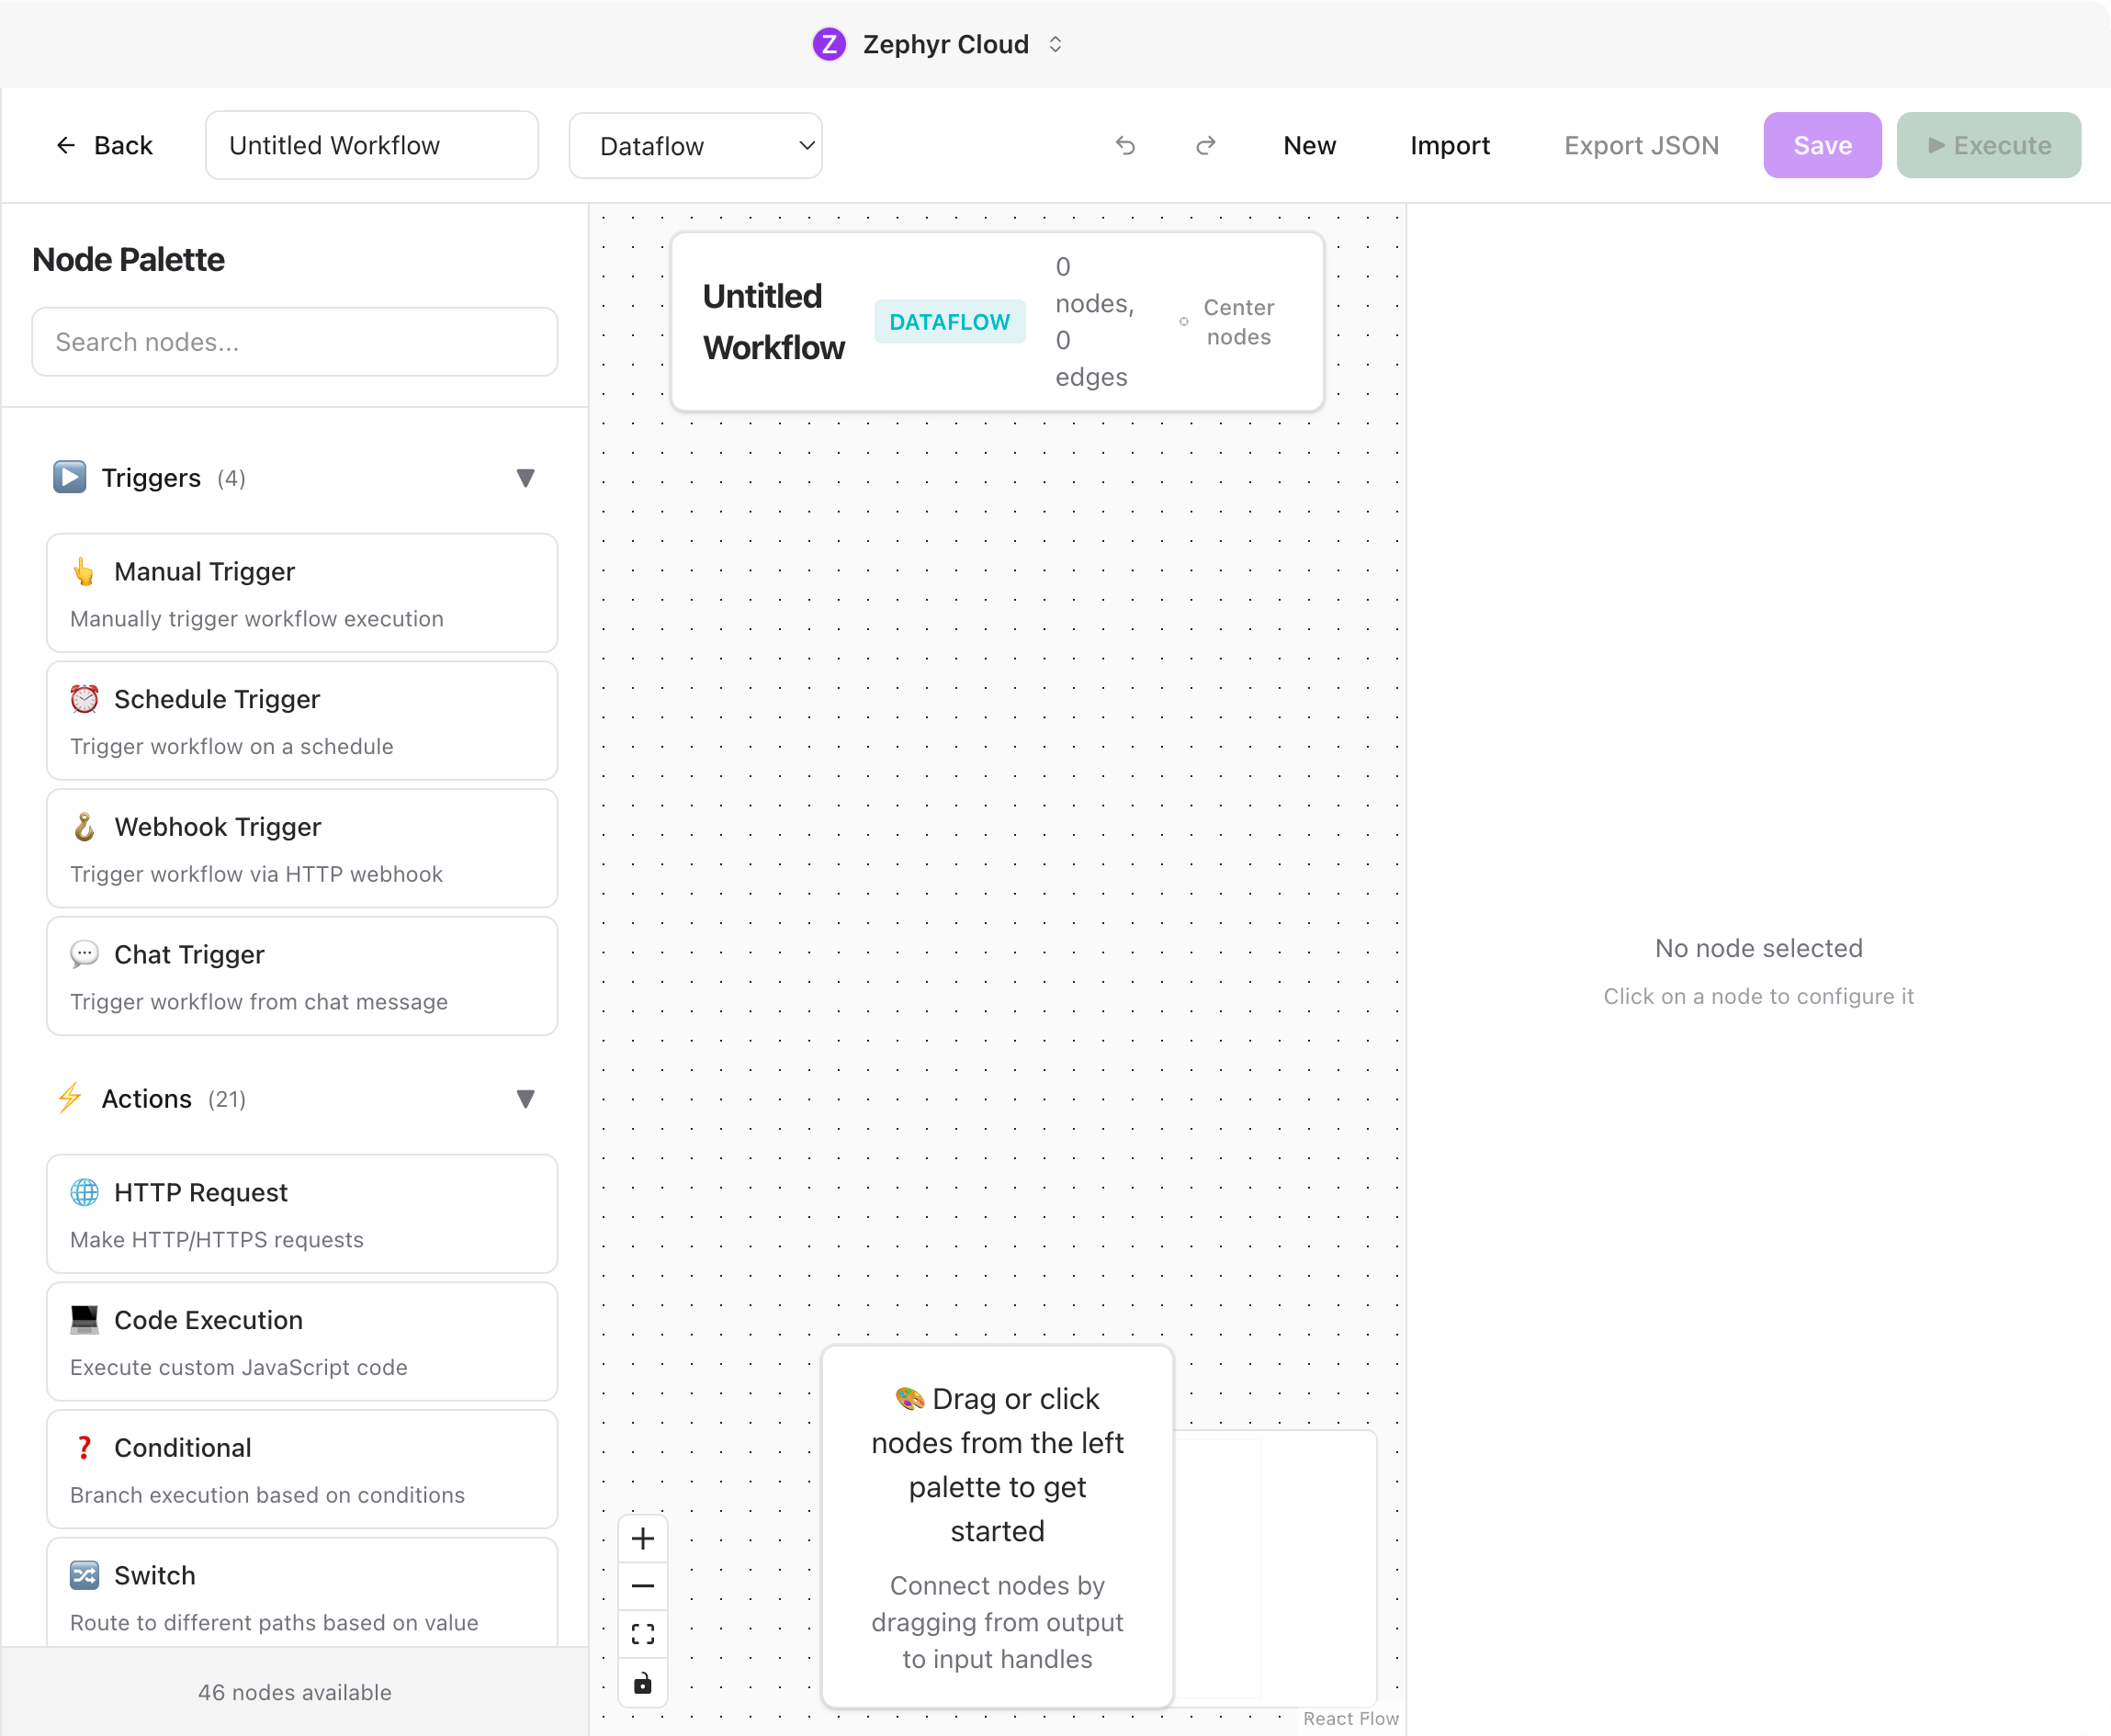
- Top toolbar for workflow-level actions (see Toolbar below).
- Node palette on the left. A searchable list of every node type, grouped by category.
- Canvas in the center. The work area where you place and connect nodes. It has a dot-grid background, zoom controls in the bottom-left, and a minimap in the bottom-right.
- Configuration panel on the right. Shows settings for the selected node. When nothing is selected it shows "No node selected — click on a node to configure it".
Toolbar
The top bar has these controls, left to right. Each one is covered in detail in Build & Run.
- ← Back returns to the Workflows home page.
- Workflow name is an inline-editable text field.
- Execution mode dropdown — Dataflow, State Machine, or Hybrid.
- New clears the canvas to start a fresh workflow.
- Import brings in workflows from JSON (The AI Platform, n8n, or LangGraph format).
- Export JSON downloads the current workflow.
- Save persists the workflow.
- ▶ Execute runs the workflow.
Node Palette
The palette lists every available node, grouped into seven collapsible categories. Click a category header to expand or collapse it. The number in parentheses (e.g. Triggers (4)) is the count of nodes in that category.
Each category has its own color, which carries over to the node body on the canvas and the dot in the minimap, so you can see at a glance what kind of work each part of the flow does.
Use the search box at the top of the palette to filter nodes by name or description across every category.
What to Explore Next
- Build & Run. Add nodes, configure Specialist Invoke outputs and prompts, save, execute, and import/export.
- Channels. Trigger workflows from chat messages with the Chat Trigger node.
- Specialists. Use the Invoke Specialist action node to delegate steps to an AI specialist.
- Tasks. Have a workflow create or update tasks as it runs.